Studying a crowdfunding campaign can be confusing
Especially if it’s closed. Looking back through updates and comments can get difficult, not to mention boring.
Things get a little easier if you can see the effect of things in a graphical format. Being able to see how quickly a campaign funded, and where there were spikes of activity help you look for comments and updates around that time.
Campaign analyzers give you more detail
They break the whole campaign down by day. You can look for changes and trends, then look for what caused the change.
For example, what happened on the 8th day of this campaign to turn it around so dramatically?
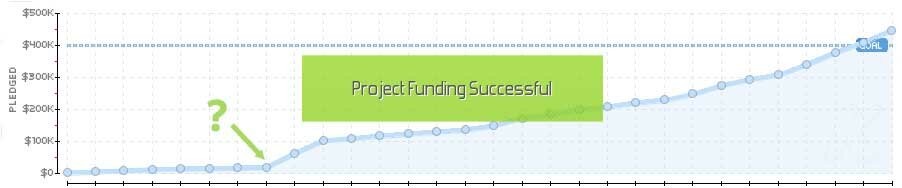
Kicktraq data for a Kickstarter project
There are two main analyzers around right now
They are Kicktraq, and Crowdlogs.
Kicktraq exclusively covers Kickstarter projects. While Crowdlogs covers Indiegogo, Patreon and Kickstarter.
I’m not happy enough with Crowdlogs’ data at this point in time to recommend them. Currently, the website doesn’t even display the correct totals much of the time.
The rest of this post will look at Kicktraq in depth, and show you how to use the data to research your crowdfunding examples.
Kicktraq
What data do you get?
As well as the ‘Campaign Progress’ graph (shown above), you also get two very useful graphs: Pledges Per Day and Backers Per Day.
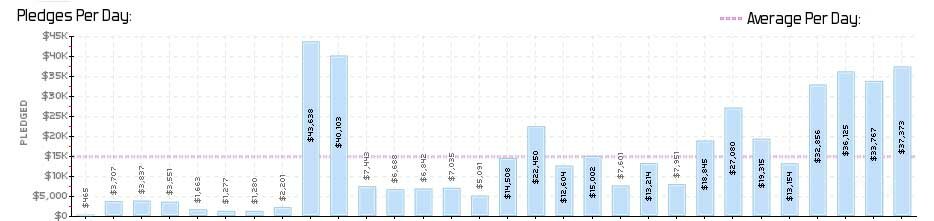
Kicktraq Pledges Per Day graph
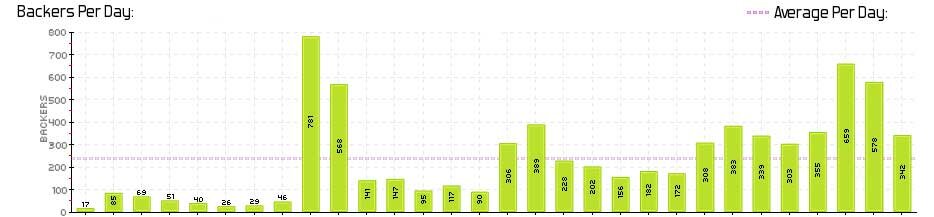
Kicktraq Backers Per Day graph
How do you use it?
Well, let’s try and answer the question I posed above? What happened on Day 8?
Sometimes a campaign gets a ‘super backer’ – one individual who gives a very big donation to the campaign.
But because we can see both how many backers AND how much money way given, we can tell that the spike was caused by a genuine increase in supporters.
What does it mean?
It could mean anything. Most likely this was caused by either media coverage to a great audience, or a promotional activity.
To work out which, you could use Google Advanced Search and narrow the dates down to the period of increased activity.
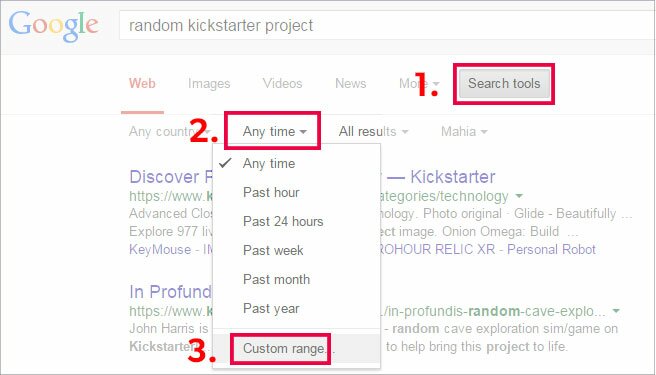
Using Google Advanced Search to narrow down date ranges
This might shed some light on any media attention during this period.
You could also look at the project’s comments and updates section for an explanation.
If you find no answers, then you can reasonably expect some kind of PR or promotion service was bought in. Why not message the creator and find out who they used?
Takeaways
Kicktraq is a tool that gives you a high-level-overview on the way a campaign was run. It gives you an idea of where to look in order to find out the kind of promotional tools they used to get their campaign to success.
Some useful data comes from Crowdlogs, but currently the verifyible data is wildly inaccurate in many cases. If this improves, I will update this page to show how Crowdlogs can help you research Patreon and Indiegogo projects as well.


")